PART 1: Main Information of On-site Test
Table 1: Test Details & Basic Information
| Category | Details |
| On-site Tester | Dou Weidong |
| Weather | Sunny |
| Test Location | A certain gas transmission station |
| Test Object Type | Natural gas pipeline |
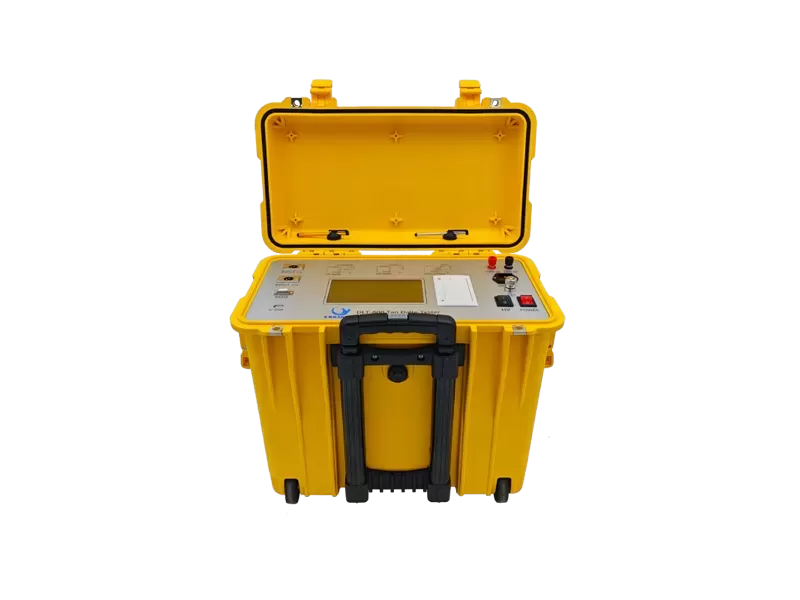
| Instrument Used | PHD-30 |
| Test Data | Yes |
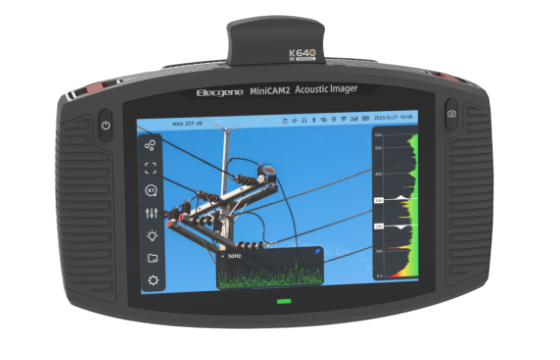
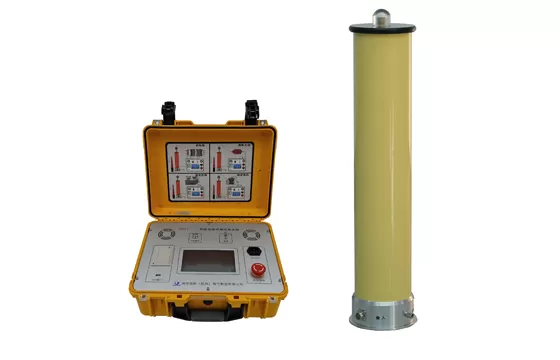
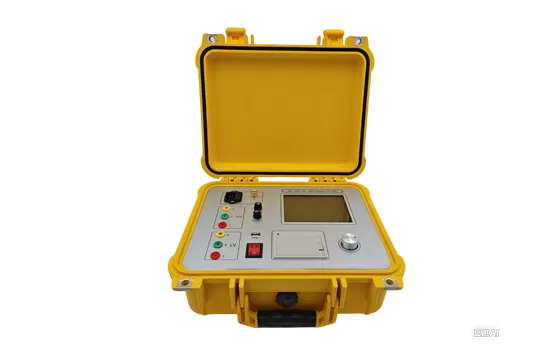
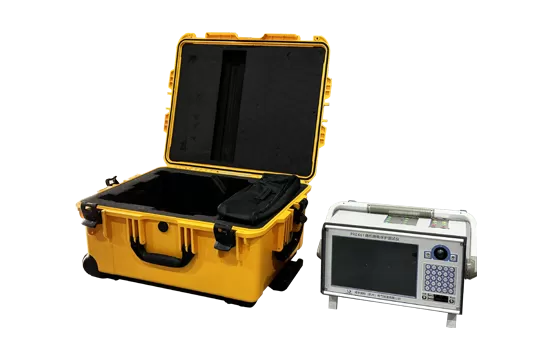
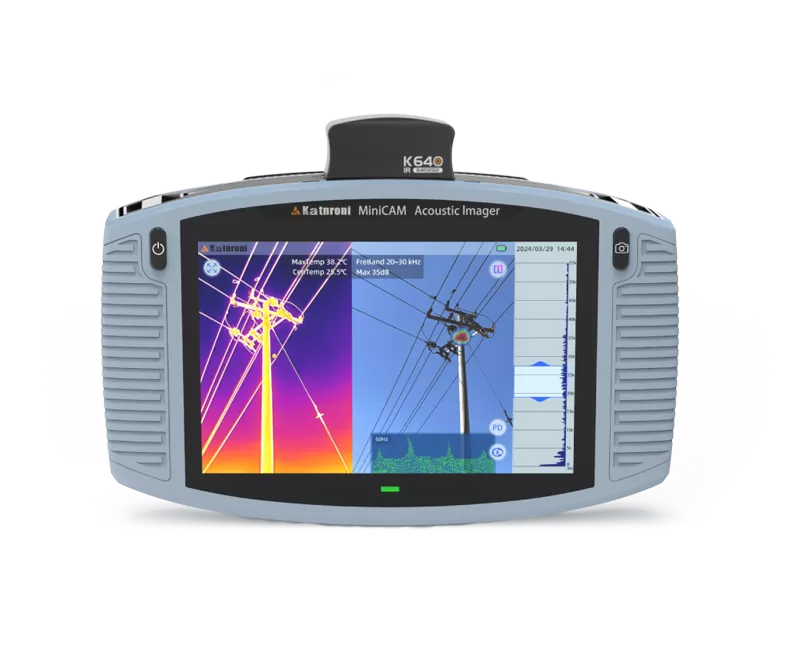
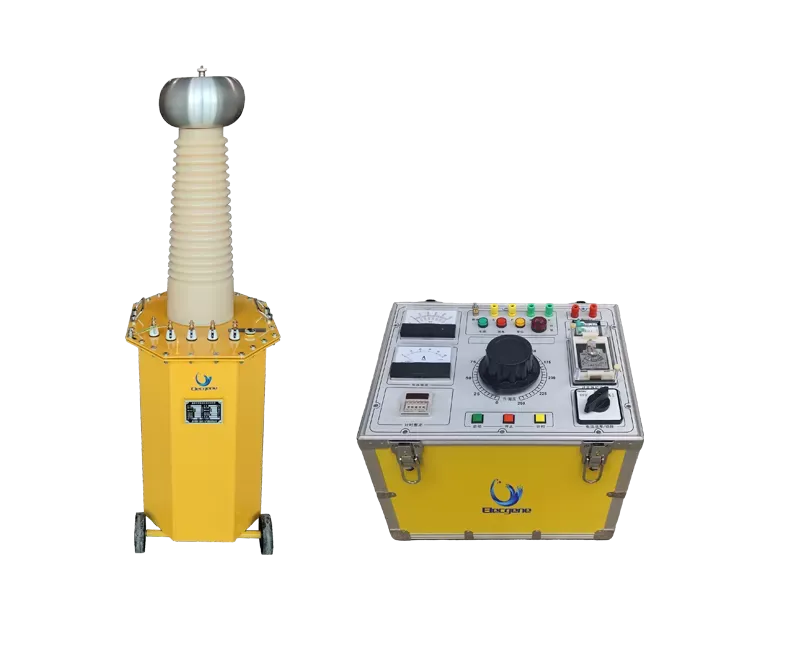
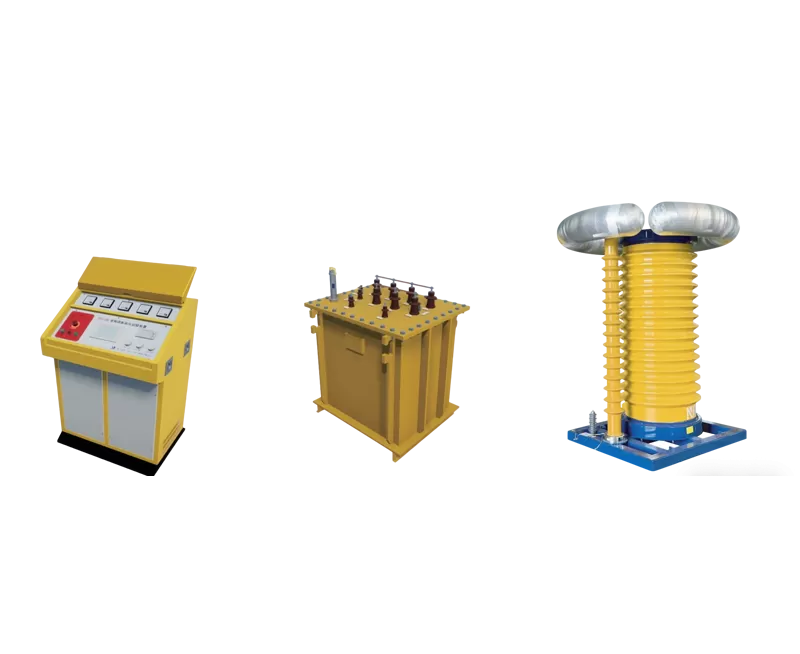
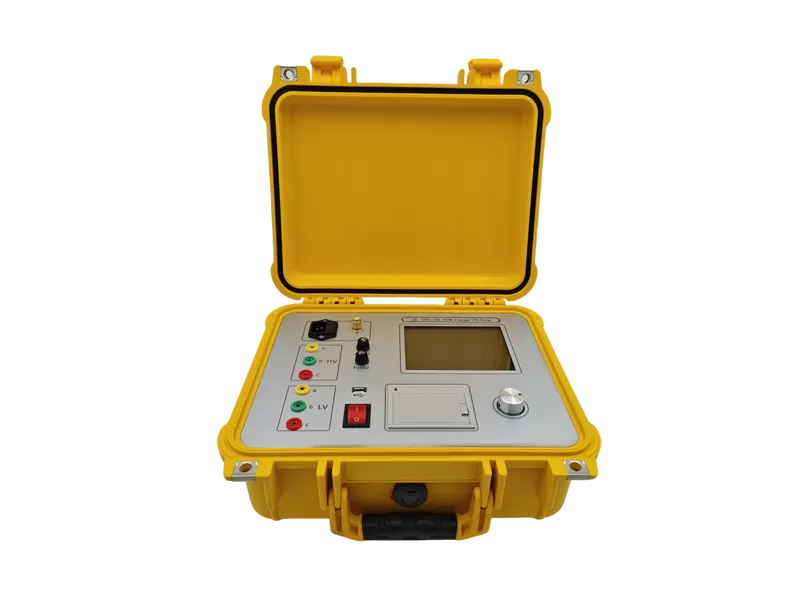
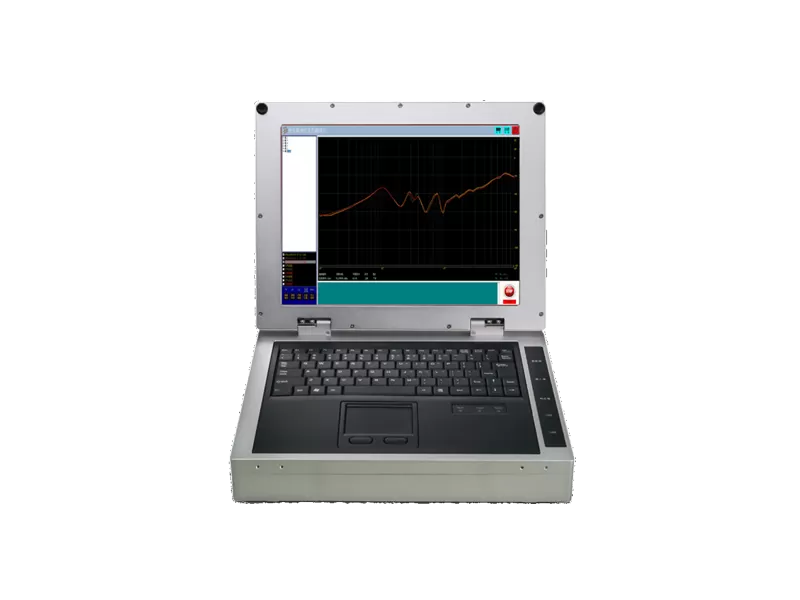
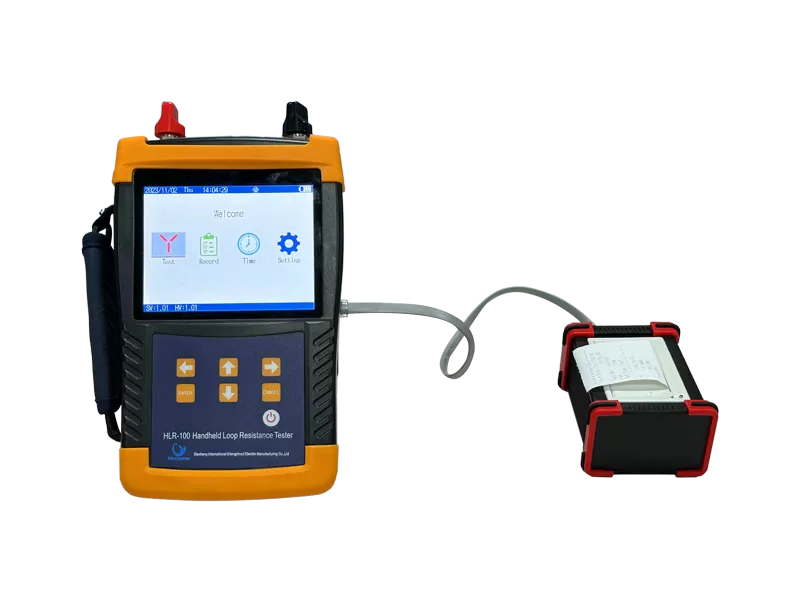
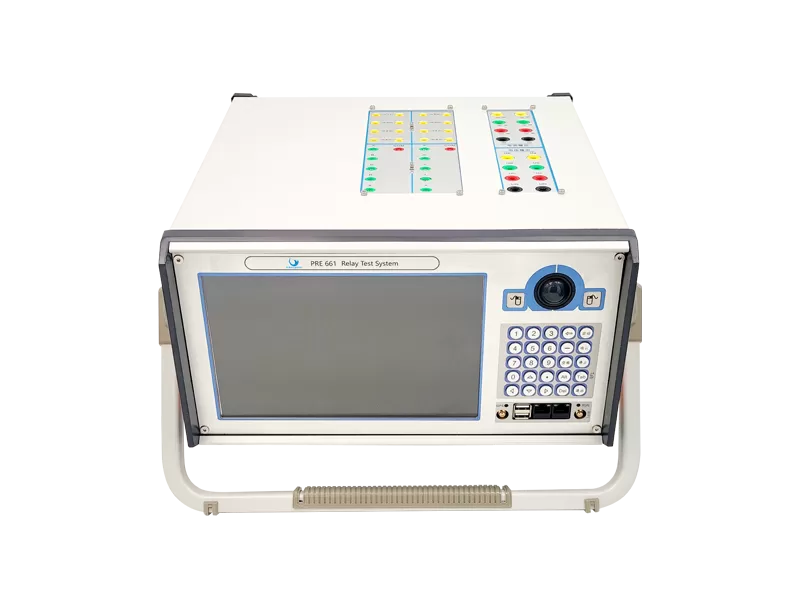
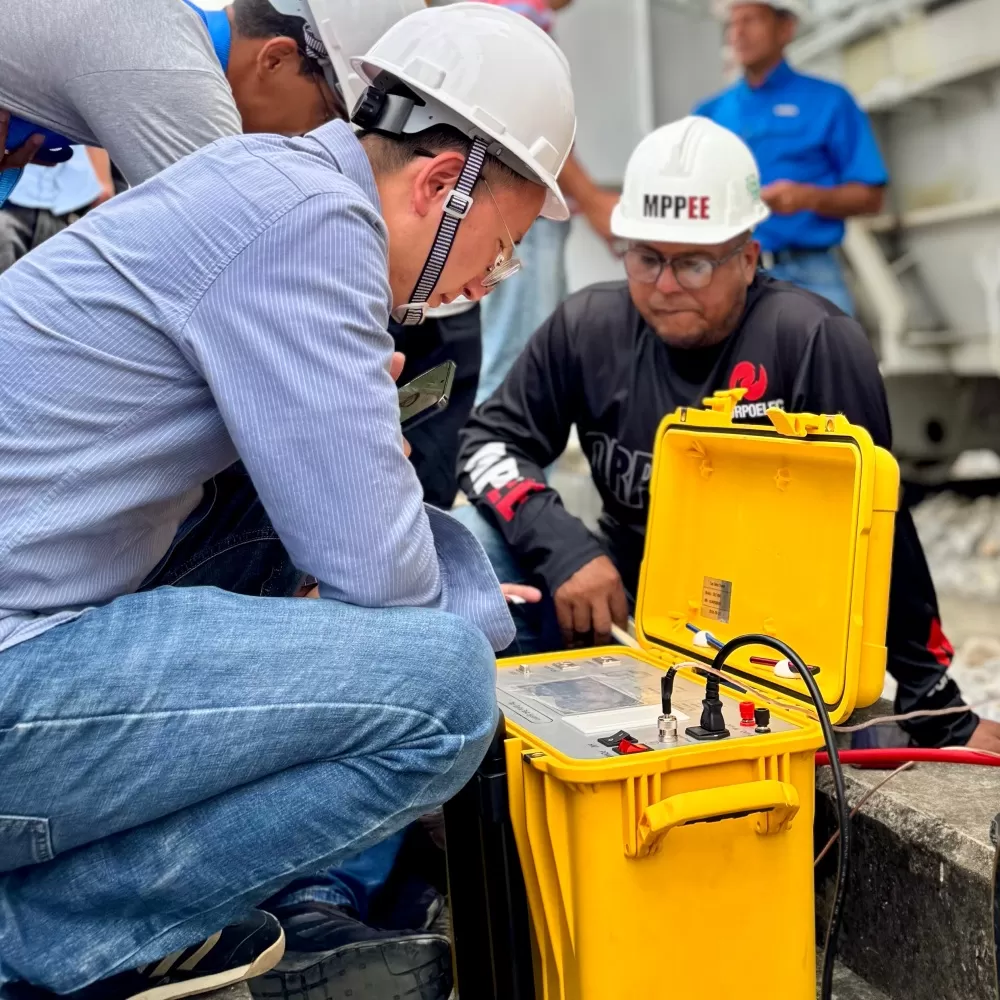
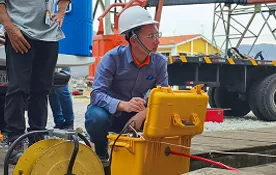
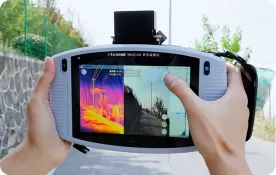
On-site Test Instrument Pictures
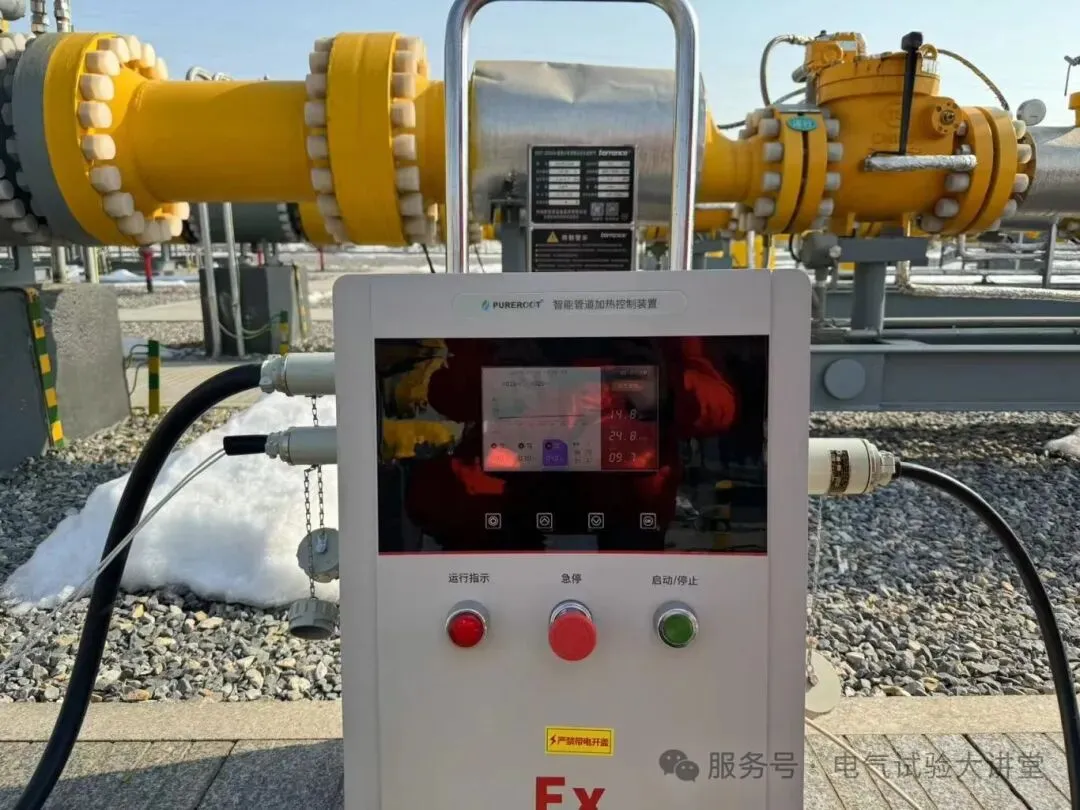
PART 2: On-site Background
As the transmission pressure of long-distance natural gas pipelines gets higher and higher, the phenomenon of pipeline ice blockages is also becoming more serious. Practice shows that there are two main reasons for ice blockages: First, before the long-distance natural gas pipeline is put into operation, the residual water in the pipeline is not completely cleaned up during the pigging process after the hydrostatic test, resulting in a large amount of water remaining in some pipe sections, which directly freezes or forms natural gas hydrates when the temperature is low. Second, when natural gas passes through equipment such as pressure-regulating skids at the station, the temperature drops sharply due to the throttling effect (Joule-Thomson effect). When the pipeline temperature is lower than the water dew point of the natural gas, water molecules in the natural gas components precipitate, forming natural gas hydrates under high-pressure and low-temperature conditions, thereby causing ice blockages. Ice blockages in long-distance natural gas pipelines seriously affect normal gas distribution and supply, as well as pipeline safety, and can cause major economic losses in severe cases.
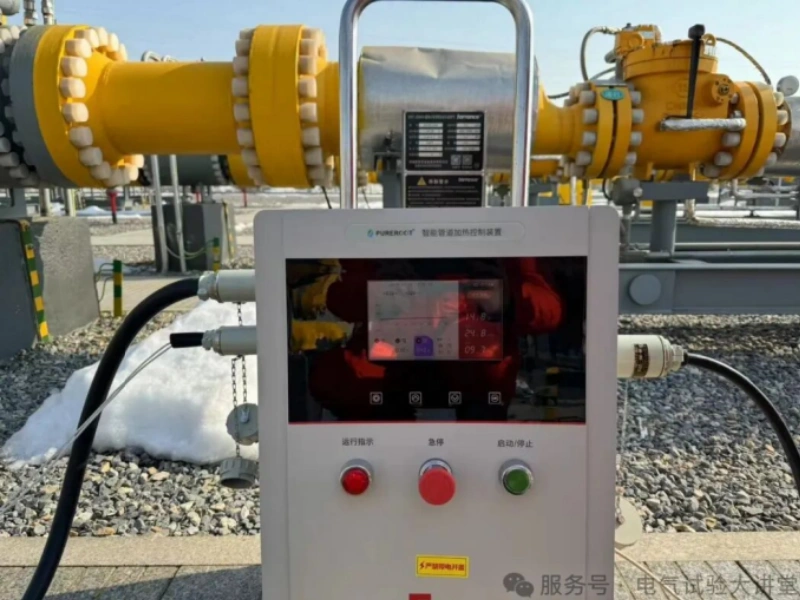
Through research on the mechanism of ice blockage formation, Xianheng International (Hangzhou) Electrical Manufacturing Co., Ltd. designed and developed the PHD-30 intelligent pipeline heating device. It adopts an explosion-proof structure design and a brand-new induction blanket design, utilizing intelligent digital control technology to realize heating functions for different pipelines and equipment.
PART 3: Instrument Overview
The intelligent pipeline heating control device uses electromagnetic induction heating technology to heat equipment such as oil and gas pipelines and pressure-regulating valves. Its basic principle is to invert a 50Hz power frequency power supply into a single-phase power supply with an adjustable frequency of 10kHz—40kHz, which acts on pipelines, pressure regulating valves, and other equipment to generate eddy currents, causing the metal itself to generate heat. The intelligent pipeline heating control device adopts a non-contact electromagnetic induction heating method and an explosion-proof portable structure design. This avoids the defects of traditional electric heating products, which are flammable and explosive due to their own high temperatures, have low thermal efficiency, and are inflexible to move. It is suitable for heating and removing ice blockages from pipelines, pressure regulating skids, valves, and other equipment in the petroleum and natural gas industries.
PART 4: Test Process
1) Device Wiring
The heating blanket is the connection carrier between the device and the object being heated. One end of the heating blanket is connected to the heating blanket interface of the device through an explosion-proof plug, and the clamp at the interface must be tightened. The other end of the heating blanket consists of a varying number of blankets (the number of blankets is equipped according to the usage scenario at the time of purchase). Wrap the configured complete set of blankets tightly around the part of the heated body that needs to be heated. When installing the heating blanket, the entire set must be installed completely, and it must be ensured that the heating blankets do not overlap.
The temperature sensor is an important accessory for the device to collect temperature data for temperature regulation and protection. One end of the sensor is connected to the temperature sensor interface of the device through an explosion-proof plug, and the clamp at the interface must be tightened. The temperature probe at the other end of the sensor needs to be tightly attached to the surface of the heating part of the heated device and placed under the heating blanket, located as close to the center of the heating blanket as possible. The tightness of the temperature sensor's fit directly affects the accuracy of temperature sampling; the sensor must be attached securely during installation.
Figure 3: Equipment wiring diagram
The power cord is mainly used to supply power to the device. One end of the power cord is connected to the power cord interface of the device through an explosion-proof plug, and the clamp at the interface must be tightened. The other end connects to the three-phase power supply system. When connecting the power cord, connect the power at the instrument end first, and then connect the system power supply. When removing the power cord, remove the system power supply first, and then remove the instrument end power.
2) Power On
After confirming that all connection lines are properly connected, turn the "power switch" to the ON position. The device will power up, the screen will light up, and it will enter the main interface.Figure 4: Instrument main interface
3) Parameter Setting
After the device enters the main interface, set the three parameters: upper temperature limit, lower temperature limit, and power percentage.
PART 5: Test Results
Requirement: Prevent ice blockages in the pressure regulating valve on the gas transmission pipeline and heat the natural gas inside the pipeline.
Background: The original heat tracing tape did not achieve the ideal effect.
On-site Conditions: The power that the nearby power distribution cabinet and cables can withstand is less than the rated power of the equipment. (According to on-site conditions, the power was set to 16KW, the maximum power of the equipment is 30KW, the heating temperature is set to 35-50 degrees, and the maximum can be set to 150 degrees). The customer turned on the heating blanket during continuous gas usage, heated it, and recorded the natural gas temperature changes inside the pipeline.
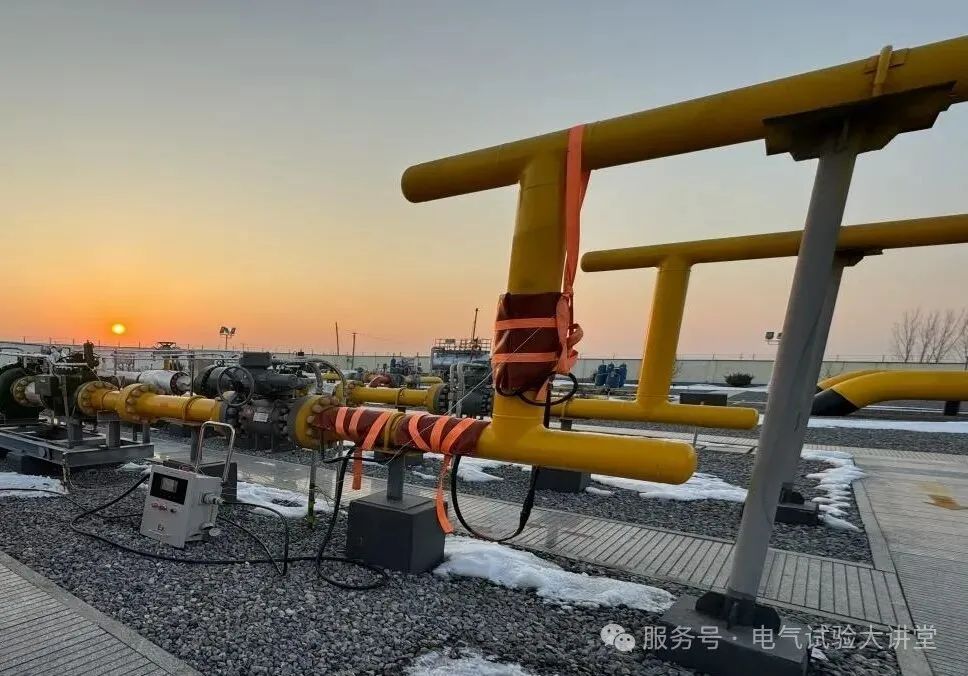
.webp "Heating blanket position (pressure regulating valve and part of the downstream pipeline).jpg")
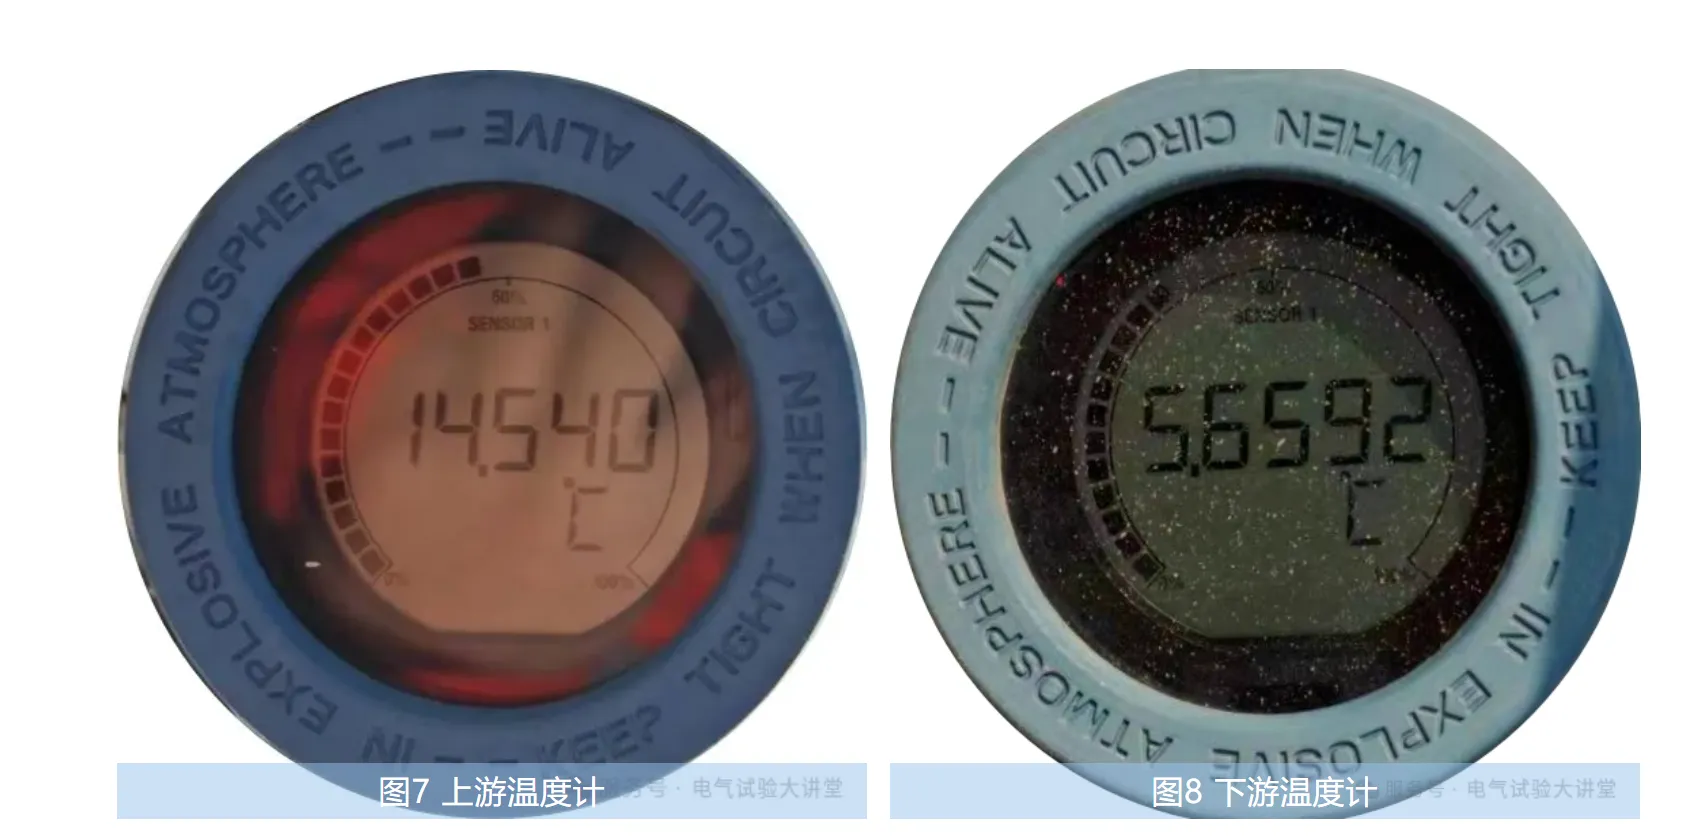
Temperature at power-on at 10:15 AM on January 11, 2024:
14.540—5.6592, temperature change 8.8808
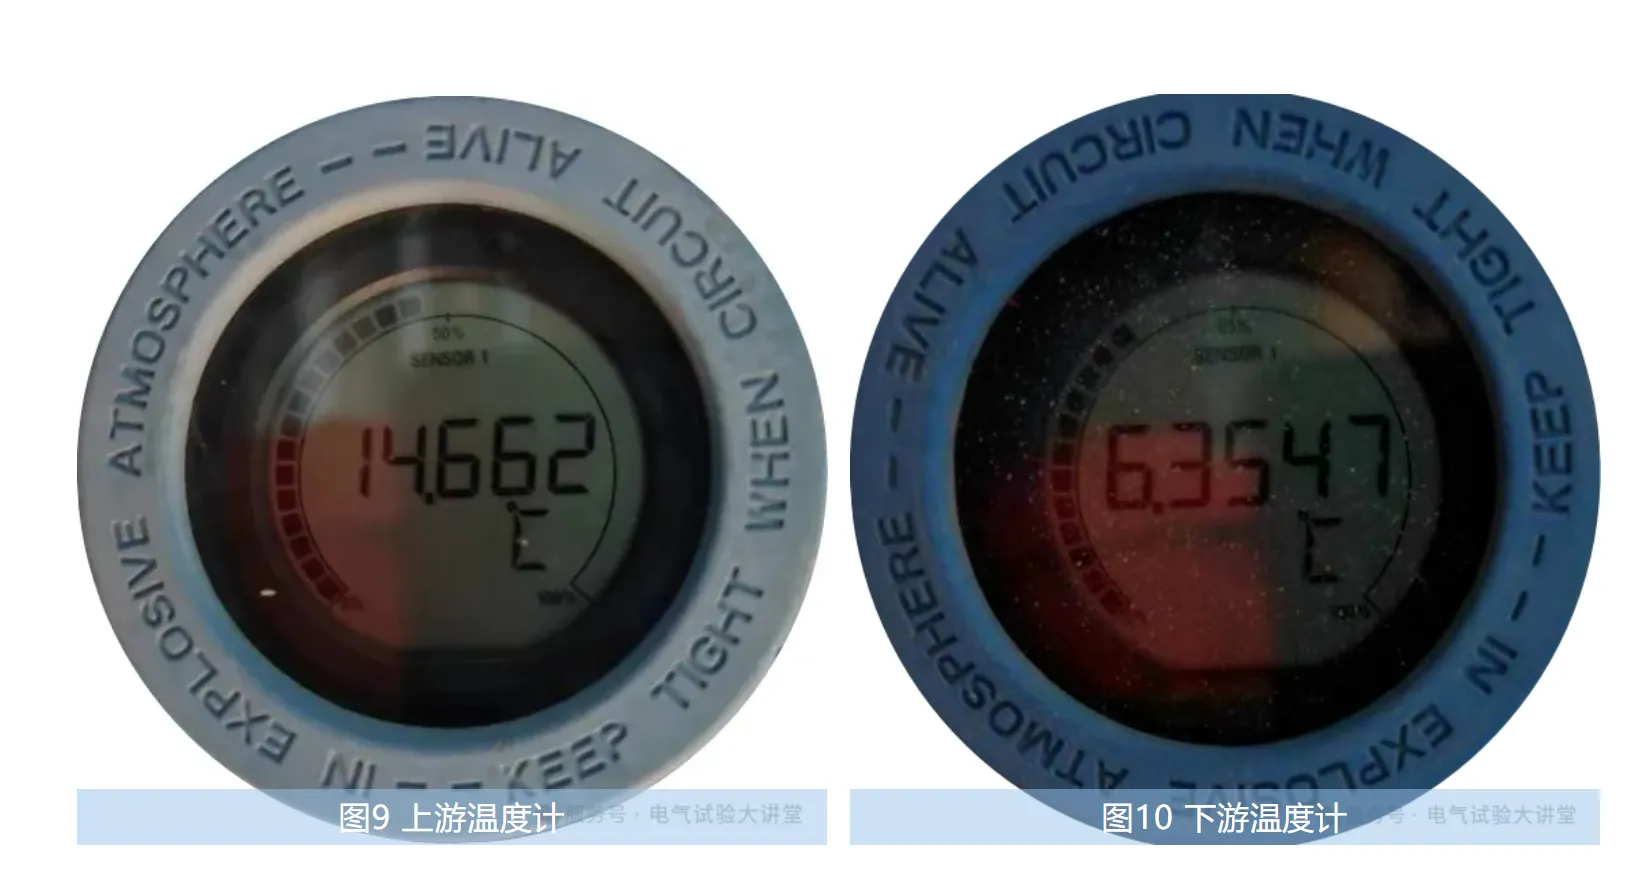
Temperature at shutdown at 16:30 PM on January 11, 2024:
14.662—6.3547, temperature change 8.3073
On-site Conditions:
The upper temperature limit is 50°C, the lower temperature limit is 35°C, and the power adjustment is 40%-59%.During nearly six hours of heating from 10:15-16:30 on the morning of January 11, the gas temperature difference changed from 8.8808 to 8.3073, a decrease of 0.5735.
Unheated Gas Temperature Change Records During Gas Intake:
Friday, January 12, 2024
| Instantaneous Gas Flow (m³) | Time | Upstream Temperature (°C) | Downstream Temperature (°C) | Temperature Change (°C) |
| 150,000 | 10:30 | 14.483 | 5.4592 | 9.0238 |
| 10:50 | 14.471 | 5.4762 | 8.9948 |
| 11:20 | 14.465 | 5.4351 | 9.0299 |
| 130,000 | 11:50 | 14.489 | 5.4701 | 9.0189 |
| 12:30 | 14.501 | 5.4823 | 9.0187 |
| 120,000 | 13:00 | 14.510 | 5.4923 | 9.0177 |
| 13:30 | 14.511 | 5.4972 | 9.0138 |
| 140,000 | 14:00 | 14.491 | 5.4184 | 9.0726 |
| 14:30 | 14.497 | 5.4536 | 9.0434 |
| 15:10 | 14.503 | 5.4353 | 9.0677 |
| 150,000 | 15:40 | 14.453 | 5.3026 | 9.1504 |
| 16:30 | 14.459 | 5.3247 | 9.1343 |
.webp "Temperature change curve (1).jpg")
Thursday, January 11, 2024 (Heating blanket turned on at 10:15)
| Instantaneous Gas Flow (m³) | Time | Upstream Temp (°C) | Downstream Temp (°C) | Temp Change (°C) |
| Set upper temp limit 50°C, Power 16.4kw, Power adj. 59% |
|
|
|
|
| 120,000 | 10:32 | 14.540 | 5.6992 | 8.8408 |
| 10:55 | 14.561 | 5.8783 | 8.6827 |
| 11:24 | 14.550 | 6.1237 | 8.5263 |
| 140,000 | 11:57 | 14.532 | 6.2711 | 8.2609 |
| 12:32 | 14.513 | 6.4247 | 8.1883 |
| Set upper temp limit 50°C, Power 16.4kw, Power adj. 40% |
|
|
|
|
| 150,000 | 13:05 | 14.446 | 6.3601 | 8.0859 |
| 13:28 | 14.495 | 6.1982 | 8.2968 |
| Set upper temp limit 50°C, Power 20.1kw, Power adj. 40% |
|
|
|
|
| 140,000 | 14:03 | 14.522 | 6.2784 | 8.3436 |
| 14:32 | 14.530 | 6.1936 | 8.3364 |
| 15:09 | 14.517 | 6.2753 | 8.2417 |
| 130,000 | 15:43 | 14.654 | 6.3126 | 8.3414 |
| 16:37 | 14.662 | 6.3547 | 8.3073 |
Data Comparison
| Time | Unheated Temperature Change (°C) | Heated Temperature Change (°C) |
| 10:30 | 9.0238 | 8.8408 |
| 10:50 | 8.9948 | 8.6827 |
| 11:20 | 9.0299 | 8.5263 |
| 11:50 | 9.0189 | 8.2609 |
| 12:30 | 9.0187 | 8.1883 |
| 13:00 | 9.0177 | 8.0859 |
| 13:30 | 9.0138 | 8.2968 |
| 14:00 | 9.0726 | 8.3436 |
| 14:30 | 9.0434 | 8.3364 |
| 15:10 | 9.0677 | 8.2417 |
| 15:40 | 9.1504 | 8.3414 |
| 16:30 | 9.1343 | 8.3073 |
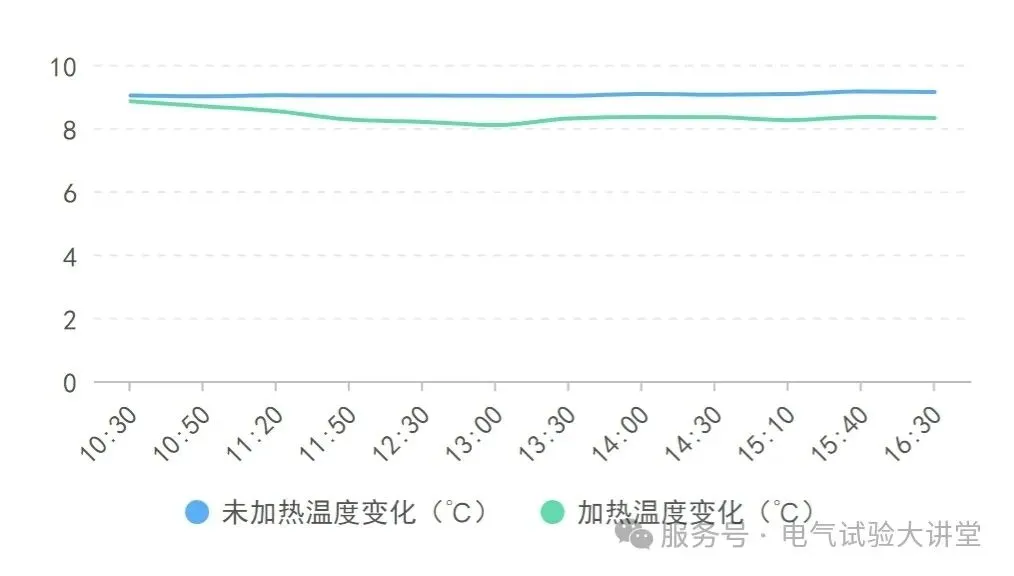
Conclusion: At comparable time points, the temperature difference showed almost no change when unheated. After heating, the temperature difference decreased; this means the degree of temperature reduction downstream became smaller, meaning the downstream temperature rose. However, due to changes in power settings, the heating temperature change was not obvious after 13:30.
PART 6: Test Summary
Before the device starts working, please confirm whether the power capacity meets the device requirements; if it does not, it can be operated at reduced power.
When connecting the device cables, please connect the power at the instrument end first, and then connect the system power supply. When removing the power cord, please remove the system power supply first, and then remove the instrument end power.
The heating blanket must be installed tightly against the heated equipment. The entire set of heating blankets must be fully installed, ensuring that there is no overlapping of the heating blankets.
To measure the temperature of the heated equipment more accurately, the temperature sensor must be placed tightly against the heated equipment.
Please install it on flame-retardant objects such as metal and keep it away from combustibles, otherwise it may cause a fire alarm!

 English
  日本語
日本語  한국어
한국어  français
  Deutsch
  русский
  português
  العربية